| Pristine Seas Sampling Model | ||||
|---|---|---|---|---|
| Site > Station > Transect > Observation | ||||
| Method | Site | Station | Transect | Observation |
| UVS | Dive survey | Depth strata | BLT (3), LPI (1), Inverts (1), Recruits (10) | Counts, biomass, cover |
| eDNA | Water collection site | Depth strata | Water bags or pumps | Species DNA |
| Pelagic BRUVS | 5-rig BRUVS deployment | Rig | N/A | Species ID, length, MaxN |
| Seabed BRUVS | Single BRUVS deployment | Single station | N/A | Species ID, length, MaxN |
| Submersible Surveys | Sub dive | Depth strata | Video transects | Species ID, counts, habitat |
| Deep-Sea Cameras | Single camera deployment | Single station | N/A | Species ID, abundance |
| ROV Surveys | ROV dive | Depth strata | Video transects | Species ID, counts, habitat |
| YSI Loggers | Logger deployment | Single profile | N/A | Temp, salinity, DO, pH |
| Bird Surveys | Survey point | Single survey | Walking transect or point count | Species counts, behavior |
Overview
Standardized protocols for marine ecosystem assessment
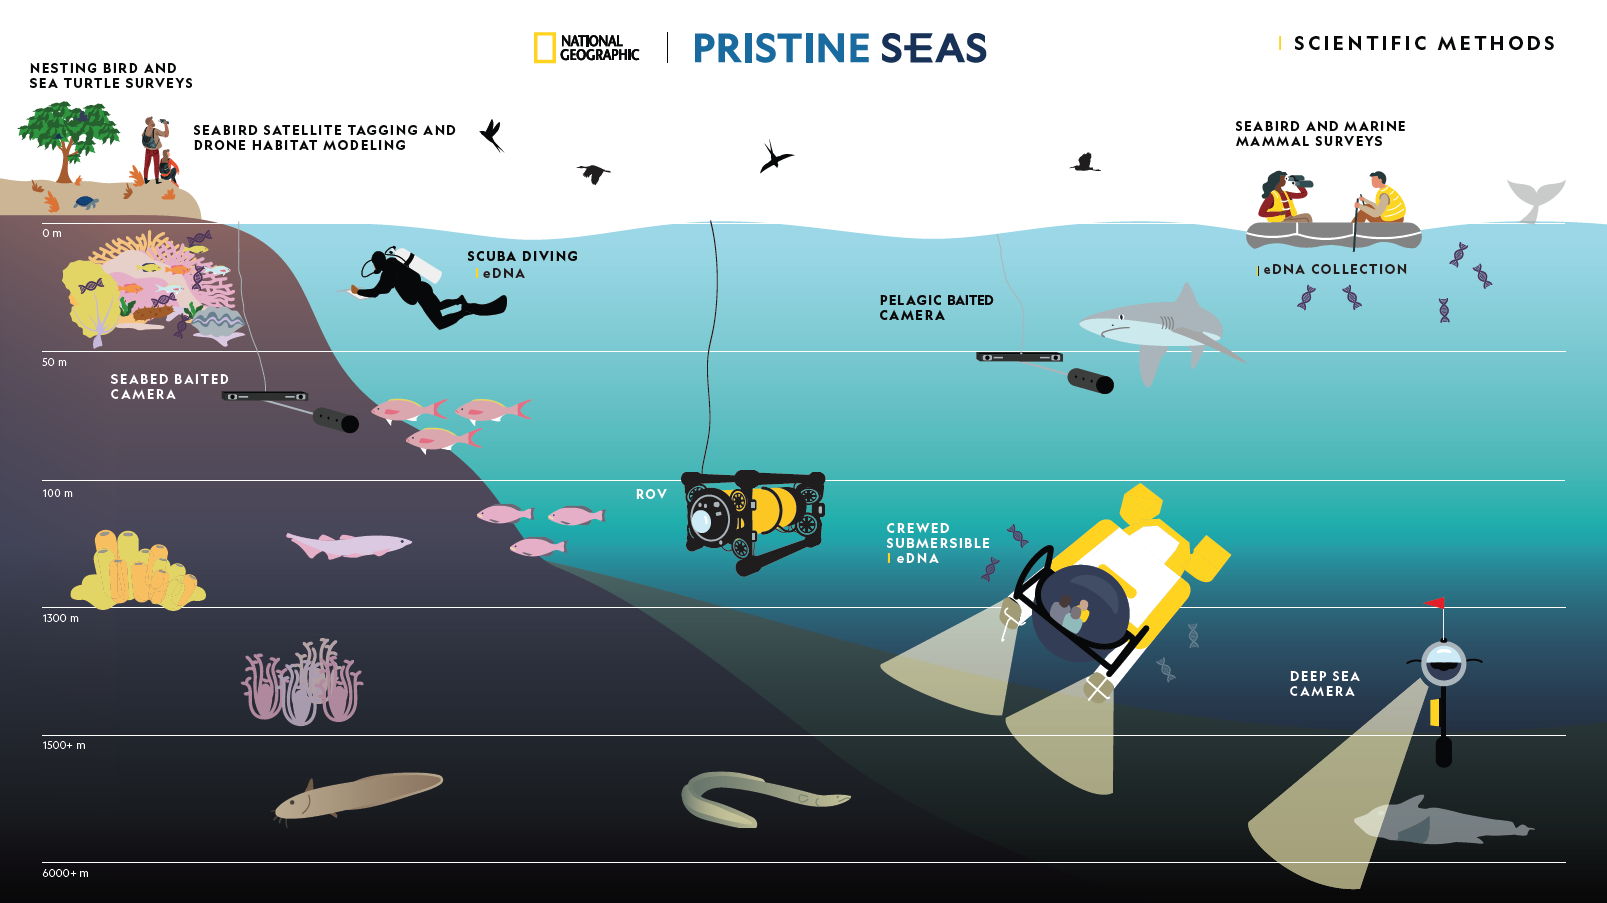
The Pristine Seas Science Team employs a range of complementary research methods to document and study marine ecosystems. Each method provides unique insights into different components of ocean biodiversity, ecological processes, and ecosystem health.
This integrated research approach allows us to:
- Establish baselines for pristine and near-pristine marine ecosystems
- Document biodiversity across a wide range of habitats and trophic levels
- Assess ecosystem health and function
- Quantify human impacts on marine environments
These insights are fundamental for effective conservation and our job includes to translate them into actionable strategies for marine protection.
Core Methods
Benthic SurveysDepths: 0-30m | Target: Benthos
|
Fish SurveysDepths: 0-30m | Target: Reef Fish
|
Environmental DNADepths: All zones | Target: All taxa
|
Seabed BRUVSDepths: 10-100m | Target: Reef Predators
|
Pelagic BRUVSDepths: Surface | Target: Pelagic Predators
|
Seabird SurveysZone: Surface | Target: Birds
|
Marine Mammal SurveysZone: Surface | Target: Mammals
|
ROV SurveysDepths: to 1000m | Target: Deep biota
|
Submersible SurveysDepths: to 1300m | Target: Deep biota
|
Deep Sea CamerasDepths: to 6000m | Target: Deep sea biota
|
Methods Integration
Our field research strategically integrates multiple assessment methods to provide comprehensive ecosystem insights beyond what individual techniques can reveal. Sampling sites are carefully selected to maximize spatial and temporal alignment across methods, enabling analyses of relationships between different ecosystem components.
To ensure seamless data integration, all methods follow standardized protocols including uniform taxonomic references, consistent metadata structures, shared spatial hierarchies, and compatible statistical approaches. This standardization facilitates robust cross-method analyses that reveal critical ecological relationships and functions.
Consistent Sampling model
The table below outlines the spatial sampling structure for each method in the Pristine Seas Science Database. It defines the hierarchical relationship from sites to observations, ensuring clarity and consistency across protocols.
The Pristine Seas Science Database serves as the central repository for this integrated data architecture, preserving methodological connections while maintaining data integrity. Complete documentation of database structure and integration protocols is available here.
General Data Worklow
The diagram below illustrates the journey of field data from initial collection to its final integration within our database. This structured workflow ensures that data collected from diverse locations and methods is processed and stored consistently. As our network of collaborating researchers grows, maintaining this standardization is crucial—not only for ease of analysis but also to safeguard the scientific integrity of our collective work.
Code
flowchart LR
    subgraph Field["🔍 Field Collection"]
        direction TB
        A[Data Collection] --> B[Field Validation]
        B --> C[Daily Entry]
    end

    subgraph Process["🔄 Data Processing"]
        direction TB
        D[File Consolidation] --> E[Quality Control]
        E --> F[Integration & Cleaning]
    end

    subgraph Analysis["📊 Data Analysis"]
        direction TB
        G[Exploratory Analysis] --> H[Statistical Testing]
        H --> I[Visualization & Reporting]
    end

    subgraph Database["🗄️ Database Storage"]
        direction TB
        J[Formatting] --> K[BigQuery Tables]
        K --> L[Cross-Method Integration]
    end

    Field --> Process
    Process --> Analysis
    Process --> Database
    Database --> Analysis

    style Field fill:#004165,color:#ffffff
    style Process fill:#8EBDC8,color:#000000
    style Analysis fill:#EA9E8D,color:#000000
    style Database fill:#F6C141,color:#000000
flowchart LR
subgraph Field["🔍 Field Collection"]
direction TB
A[Data Collection] --> B[Field Validation]
B --> C[Daily Entry]
end
subgraph Process["🔄 Data Processing"]
direction TB
D[File Consolidation] --> E[Quality Control]
E --> F[Integration & Cleaning]
end
subgraph Analysis["📊 Data Analysis"]
direction TB
G[Exploratory Analysis] --> H[Statistical Testing]
H --> I[Visualization & Reporting]
end
subgraph Database["🗄️ Database Storage"]
direction TB
J[Formatting] --> K[BigQuery Tables]
K --> L[Cross-Method Integration]
end
Field --> Process
Process --> Analysis
Process --> Database
Database --> Analysis
style Field fill:#004165,color:#ffffff
style Process fill:#8EBDC8,color:#000000
style Analysis fill:#EA9E8D,color:#000000
style Database fill:#F6C141,color:#000000
Field Collection
Field collection is the foundation of our scientific process. Every observation is documented following standardized protocols to ensure that data is consistent and reliable. We emphasize:
- Standardized fieldbooks specifically designed for each method, ensuring structured and error-free data collection.
- Consistent recording of site IDs, coordinates, date, time, and observer names for traceability.
- Common terminology for habitat types, substrates, and species to maintain comparability across sites.
- Photo documentation as visual evidence to complement written records.
- Systematic sampling methods that allow data to be compared confidently across different regions.
These protocols not only enhance the reliability of our own analysis but also make our data easily understandable and usable by other researchers working with us.
Data Entry
Once collected, data is entered into digital formats as soon as possible to prevent loss of detail and reduce errors. Our main practices include:
- Same-day data entry to keep information fresh and accurate.
- Fieldbooks with built-in error checks to minimize typos and formatting mistakes.
- Standardized file naming:
[ISO3]_[YEAR]_[METHOD]_fieldbook.xlsxfor easy identification. - Real-time backups on the ship’s storage system (NAS) to prevent data loss.
- Daily review by a data manager to spot errors early and maintain data quality.
This structured approach ensures that as more researchers join our efforts, everyone has access to clean, well-organized data that is easy to interpret and integrate across projects. It is our commitment to scientific rigor and transparency.
Media Management
Photos and videos serve as both scientific evidence and powerful tools for communicating our work. Consistent management ensures these visual assets remain accessible, properly labeled, and scientifically valuable.
Photo Management Best Practices
Good photo management is essential for documenting our scientific work. Follow these three key practices:
Organize by Station: Keep all photos in folders organized by station ID so they can be easily found later
Select Best Images: Create a collection of high-quality, labeled photos showing species, notable observations, and habitats for our reference library and reports
Use Consistent Names: Follow our standard naming approach for folders and important images
- Folders:
[ISO3]-[YEAR]-[METHOD]-[STATION_ID]
Examples:- Quadrats:
data/benthos/recruits/quadrats/PLW-2023-uvs-001-20m/ - Fish:
data/fish/photos/PLW-2023-uvs-001-20m/ - Inverts:
data/benthos/inverts/photos/PLW-2023-uvs-001-10m/ - Birds:
data/birds/photos/PLW-2023-birds-001/
- Quadrats:
- Selected Images:
[ISO3]_[YEAR]_[METHOD]_[STATION_ID]_[DESCRIPTION].jpg
Examples:- Birds:
media/science-collection/birds/PLW_2023_birds_001_frigatebird.jpg - Fish:
media/science-collection/fish/PLW_2023_uvs_001_20m_acanthurus_lineatus.jpg - Submersible:
media/science-collection/sub/PLW_2023_sub_08_gorgonian_fan.jpg
- Birds:
- Field Photos: Only selected highlights need complete labels; other field photos can remain as-is if stored in properly labeled station folders
Examples:- Quadrats:
data/benthos/recruits/quadrats/PLW-2023-uvs-001-20m/q3_IMG0042.jpg - Birds:
data/birds/photos/PLW-2023-birds-001/canon_2023-08-01_12-00-00.jpg
- Quadrats:
- Folders:
Save all photos to the NAS daily. The data manager will transfer everything to Google Drive after the expedition.
Video Footage Best Practices
Managing footage from remote cameras (BRUVS, deep-sea cameras, ROV, submersible) requires organization to make the most of these valuable recordings. Follow these key practices:
- Use a Central Highlights Folder: Save all important video clips and screenshots to the appropriate method’s highlights folder
- Examples:
- Seabed BRUVS:
sbruv/highlights/ - Pelagic BRUVS:
pbruv/highlights/ - ROV:
rov/highlights/ - Submersible:
sub/highlights/ - Deep-sea cameras:
deepsea/highlights/
- Seabed BRUVS:
- Examples:
- Name Files Consistently: Use our standard format for all highlight files
- Standard Format:
[ISO3]_[YEAR]_[METHOD]_[STATION_ID]_[DEPTH]_[DESCRIPTION].mp4 - Examples:
- Seabed BRUVS:
FJI_2025_sbruv_001_40m_grouper_school.mp4 - Pelagic BRUVS:
FJI_2025_pbruv_003_silky_shark.mp4 - ROV:
FJI_2025_rov_002_350m_soft_coral_garden.mp4 - Submersible:
FJI_2025_sub_005_800m_deep_reef_community.mp4 - Deep-sea camera:
FJI_2025_dscm004_1200m_cusk_eel.mp4
- Seabed BRUVS:
- Standard Format:
- Use Standard File Formats: Make sure everyone can open and view your files
- Video Clips: Save as
.mp4format for all video highlights - Screenshots: Save as
.jpgformat for all still images - Clip Length: Keep highlight clips between 10-60 seconds
- Resolution: Maintain 1080p resolution
- Video Clips: Save as
- Include Important Details: Make sure others can understand what they’re seeing
- Include depth information for all depth-related methods
- Use descriptive names that indicate content (species, behavior, habitat)
- Note the time code from original footage when possible
- Capture These Key Moments:
- Diversity and MaxN: Footage showing multiple species or high numbers
- Behaviors: Interesting activities like feeding, schooling, or cleaning
- Habitats: Good examples of different habitat types
- Notable Finds: Rare species, unusual interactions, or new records
Save all highlight files to the NAS daily. The data manager will transfer everything to Google Drive after the expedition.
While more detailed guidelines can be found in the Media Library section, these practices ensure that our photos and videos are properly organized and can be easily connected to our scientific observations.
Processing Pipeline
We use method-specific standardized scripts (pipeline_[method].qmd) to transform raw field observations into clean, analysis-ready datasets. Although each method follows a unique pipeline, the overall structure remains consistent, ensuring data integrity, traceability, and seamless integration into the Pristine Seas Science Database.
Data Ingestion and Harmonization
- Data Ingestion: Gather and merge raw field data from multiple expedition legs and contributors.
- Standardization: Apply consistent field names, units, and formats to match database schema.
- Spatial Context: Harmonize geographic data across the established hierarchy:
- Region → Subregion → Locality → Site → Station
- Terminology Alignment: Enforce consistent language for habitats, strata, and exposure types.
QA/QC
- Sampling Effort Verification: Assess completeness and alignment with sampling protocols.
- Exploratory Visualizations: Generate maps and plots to visually inspect patterns.
- Spatial and Temporal Validation: Check station alignment and method overlap across regions.
- Data Completeness Assessment: Identify missing values and ensure records are logically complete.
- Outlier and Anomaly Detection: Flag improbable values and check for inconsistencies.
- Protocol Deviation Documentation: Record any departures from standard field protocols.
Taxonomic Validation
- Species Identification Checks: Cross-reference observed taxa with the Pristine Seas Taxonomic Database.
- Resolve Inconsistencies: Correct synonyms, misidentifications, and hierarchical misalignments.
- Harmonize Across Regions: Ensure consistent naming and classification throughout the dataset.
Ecological Metric Calculation
- Compute key ecological indicators at relevant spatial scales:
- Biomass (
g/m²) - Species Richness
- Diversity Indices (e.g., Shannon, Simpson)
- Trophic Composition
- MaxN (Maximum Number Observed Simultaneously)
- Biomass (
- Generate summary tables at multiple ecological and political levels:
- Taxa → Station → Site → Subregion → Region
- Produce both detailed observation-level tables and summary statistics for downstream analyses.
Output Standardization and Database Integration
- File Naming Convention: Apply a consistent format for traceability:
[ISO3]_[YEAR]_[METHOD]_[TYPE].csv- Examples:
PLW_2023_fish_observations.csv,FJI_2025_coral_cover.csv
- Database Upload: Load processed and validated datasets into the Pristine Seas Science Database.
- Media Linkage: Attach relevant photos and video highlights for cross-referencing.
Exploratory Data Analysis (EDA)
The Exploratory Data Analysis (EDA) stage transforms standardized datasets into actionable insights that inform scientific reports and conservation strategies. During this phase, we go beyond surface-level exploration to actively seek indicators of ecosystem health, conservation effectiveness, and environmental threats. Analyses are performed in eda_[method].qmd, with a strong emphasis on generating meaningful ecological narratives and identifying conservation priorities.
Data Visualization
- Create maps, summary plots, and interactive visualizations to reveal spatial and temporal patterns.
- Generate summary statistics for key ecological metrics:
- Biomass, species richness, diversity indices, and trophic composition.
- Visualize ecological gradients across depth, region, and habitat types.
- Explore habitat-specific assemblages and species distributions to detect community shifts.
Contextual Analysis and Ecological Inference
- Compare findings across regions, depth strata, and time periods to identify ecological shifts.
- Integrate results from multiple survey methods to build a comprehensive view of ecosystem dynamics.
- Contextualize observations with known baselines, historical data, and previous expeditions.
- Detect range extensions, new records, and unusual species aggregations.
Conservation Insights
During EDA, we explicitly explore key indicators that reflect ecosystem health, resilience, and human impact. This stage is conservation-driven, aiming to identify both risks and successes:
Ecosystem Health Indicators
- Assess reef health, predator biomass ratios, and trophic balance as indicators of ecosystem stability.
- Identify keystone species and their relative abundance to understand ecosystem structure.
Overfishing Evidence
- Detect declines in critical species, particularly large-bodied predators and apex species.
- Monitor shifts in size structure and age classes, signaling fishing pressure.
Climate Change Impacts
- Look for signs of coral bleaching, range shifts, and changes in species composition.
- Investigate sensitive species loss.
Habitat Degradation
- Explore shifts in benthic cover, including macroalgae dominance, cyanobacteria blooms, and reductions in coral cover.
- Identify areas with increasing sedimentation or evidence of physical damage (e.g., fishing lines).
Conservation Success Signals
- Highlight regions with high biomass, top predator abundance, and balanced trophic structures.
- Identify MPA effectiveness by comparing protected versus unprotected areas.
Critical Habitat Mapping
- Map species home ranges, migration corridors, and nursery areas.
- Identify biodiversity hotspots and regions of ecological significance for conservation planning.