| Indicator | Metrics | Significance |
|---|---|---|
| Benthic Composition | % hard coral and CCA cover | Foundation of reef structure and growth |
| Degradation Indicators | % cyanobacteria cover | Early warning of environmental stress |
| Fish Community | Total fish biomass | Overall ecosystem productivity |
| Trophic Integrity | % biomass of sharks and top predators | Food web completeness |
| Invertebrate Status | Density of key commercial species | Resource extraction indicator |
| Recovery Potential | Coral recruitment density | Future reef trajectory |
Overview
Standardized protocols for in-situ marine ecosystem assessment
Introduction
Underwater visual surveys (UVS) are the cornerstone of Pristine Seas ecological assessments, providing a comprehensive, quantitative foundation for understanding marine ecosystem structure and function. These standardized methods enable robust comparisons across sites, regions, and time periods, creating a powerful global dataset to inform science-based conservation.
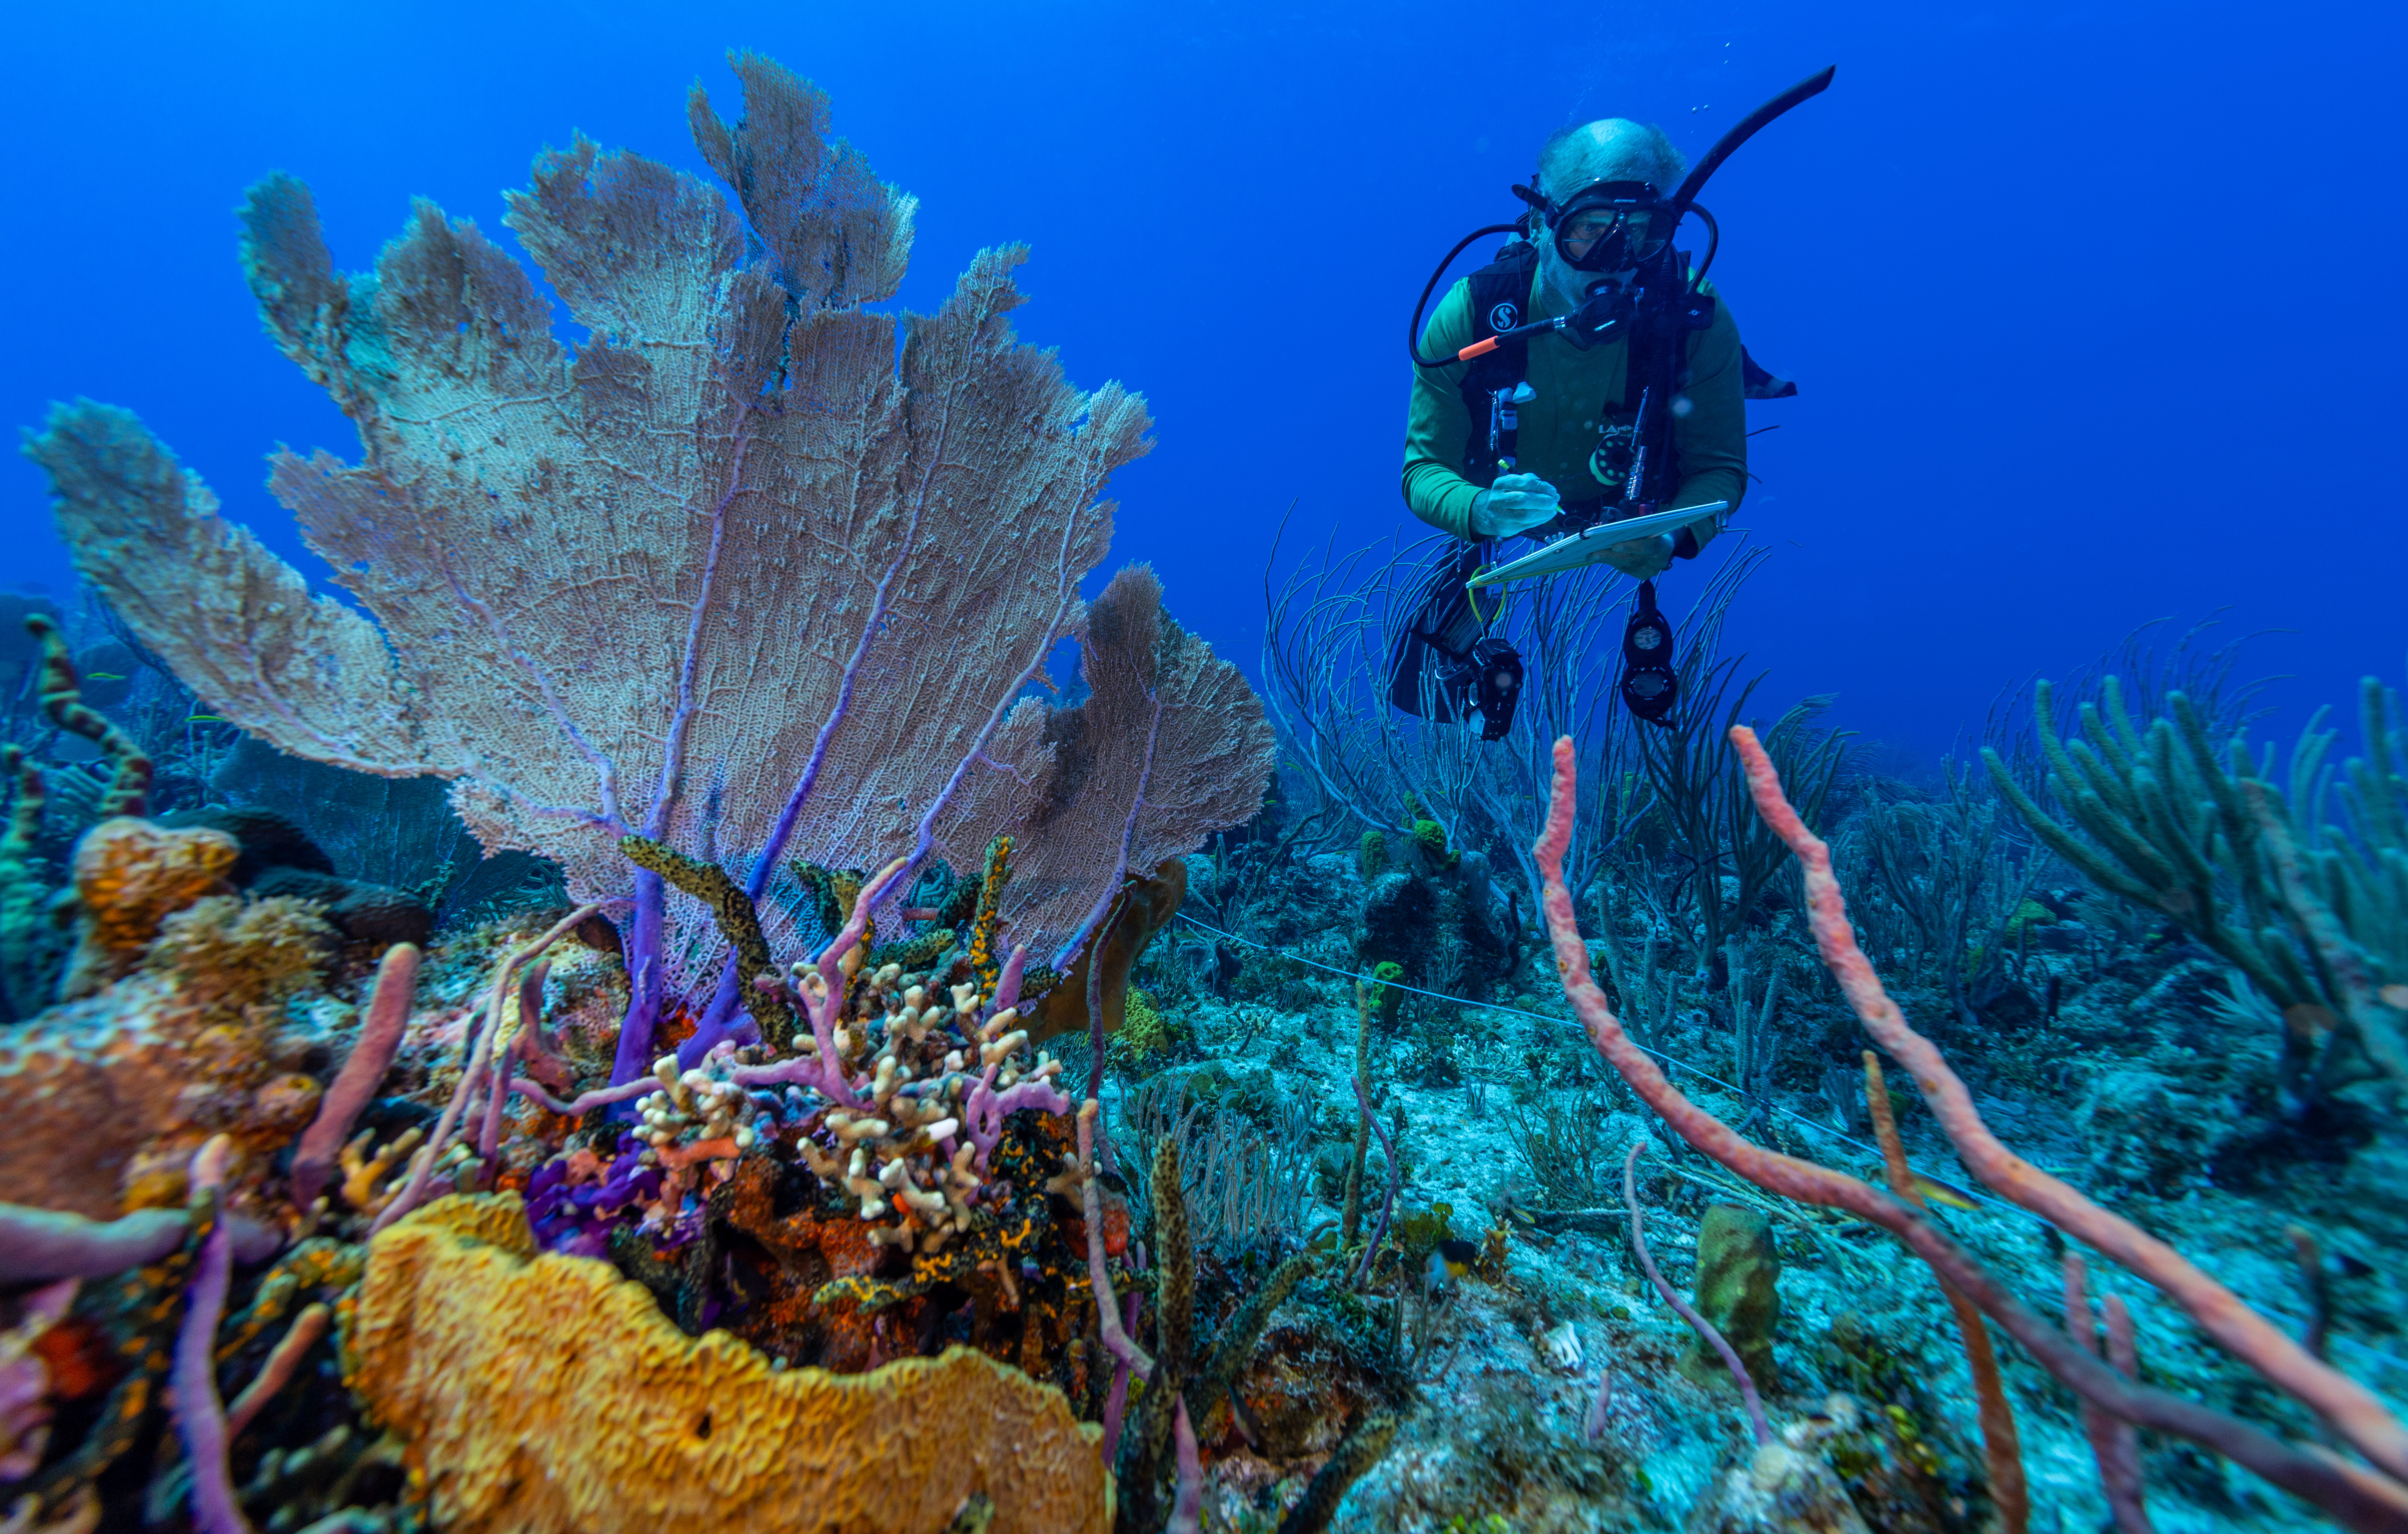
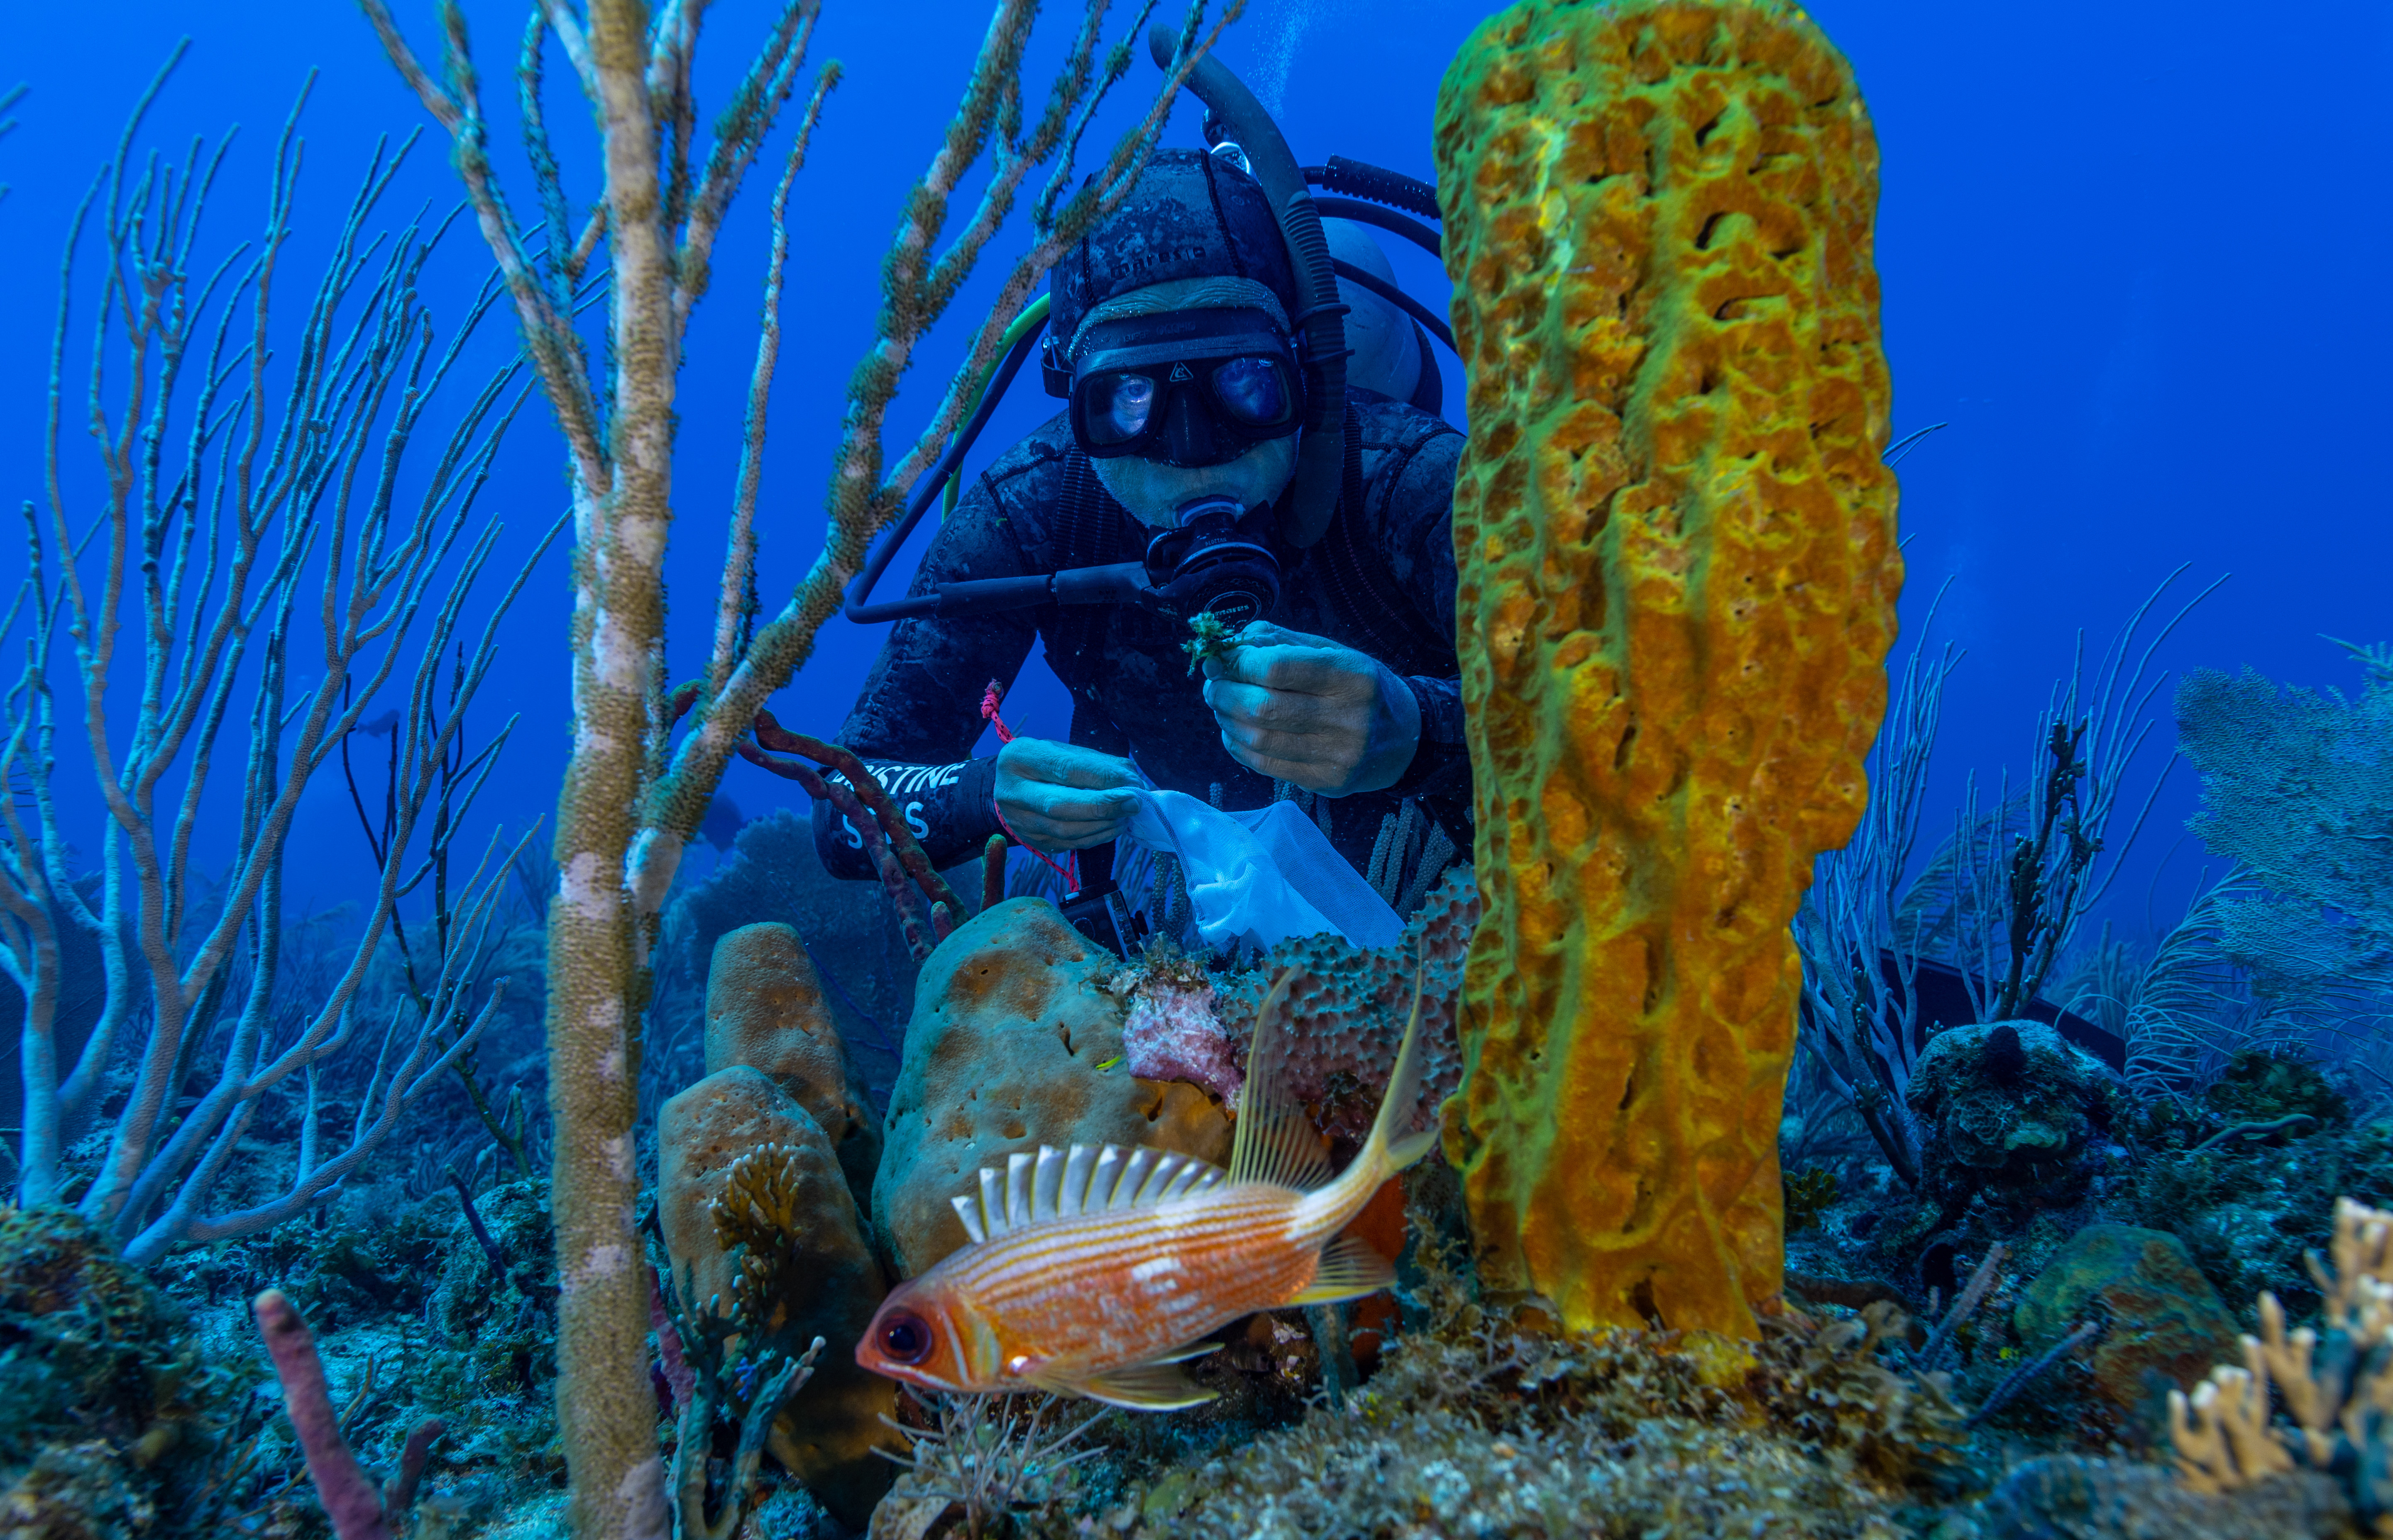
Figure 1: Pristine Seas divers conducting underwater visual surveys. Left: Fish belt transect survey. Right: Benthic survey using line point intercept method.
Through a multi-method approach, we capture the key components of marine ecosystem health: fish populations, benthic composition, invertebrate communities, and coral recruitment. This holistic assessment provides a scientific basis for identifying conservation priorities and designing effective marine protected areas.
Survey Components
The Pristine Seas underwater visual survey framework integrates four complementary components:
- Fish Belt Transects: Quantify fish diversity, abundance, and biomass
- Line Point Intercept (LPI): Assess benthic cover and composition
- Invertebrate Counts: Document mobile invertebrate abundance
- Coral Recruit Surveys: Measure coral recruitment and population dynamics
These components are conducted along the same depth strata but on separate transects that are co-located as closely as possible within the same habitat and site. This approach allows for comprehensive sampling of each ecosystem element.
Survey Structure
Sites
Each underwater visual survey location is designated as a site. Sites form the primary organizational unit for our surveys and are carefully selected to represent the full range of marine environments within the study area.
Site Selection Criteria:
- Habitat representation: Major habitat types present in the region (e.g., forereef, lagoon, backreef)
- Exposure gradient: From protected/sheltered to exposed locations
- Protection status: Both inside and outside protected areas when applicable
- Community input: Locations identified by local knowledge as important
- Accessibility: Practical considerations for safe dive operations
Stations
Each site contains stations at different depths to capture vertical zonation patterns. Typically, two depths are surveyed at each site and the specific depths surveyed depend on local bathymetry, habitat distribution, and research priorities. In some locations, only one depth strata may be present or accessible. In this cases, the team may double the sampling effort at the single station.
Standard UVS depth strata
Every survey station is assigned to one of three standardized depth strata with corresponding suffixes that build the station label:
Depth strata and suffixes:
- Supershallow (
≤ 6 m) →05m
- Shallow (
7–14 m) →10m
- Deep (
≥ 15 m) →20m
Station ID structure: [ISO3]_[YEAR]_uvs_[SITE]_[Depth_suffix]
Examples:
- First survey of Fiji’s 2025 expedition at 5.8 m →
FJI_2025_uvs_001_05m - First survey of Fiji’s 2025 expedition at 12 m →
FJI_2025_uvs_001_10m
This scheme ensures consistent stratification across all analyses, even with natural variation in survey depth.
Transects
At each station, survey methods use multiple standardized transects at consistent depth contours to derive robust station averages. These function as pseudoreplicates rather than independent samples, improving precision and accounting for small-scale spatial variation. Detailed specifications are provided in each method’s dedicated section.
Field Operations
The Pristine Seas underwater visual surveys involve careful coordination between multiple divers conducting complementary assessments at each site. This orchestrated approach maximizes data collection efficiency while maintaining scientific rigor and preventing interference between methods.
Dive Team
Fish Survey Team
- 2 divers
- Work independently at each depth strata
- Rotate depths between dives
Benthic Survey Unit
- 3 divers (LPI, Coral, Inverts/Recruits)
- Work as a coordinated unit across both strata
Schedule
The typical expedition schedule includes three dives per day:
- 2 morning dives (08:00-12:00)
- 1 afternoon dive (14:00-16:00)
Choreography
- Site preparation:
- Dive boat positions at GPS coordinates
- Entry point marked with mooring or surface marker
- Team conducts pre-dive briefing
- YSI profile taken and surface eDNA samples collected if applicable
- Descent sequence:
- Team descends together to the deeper station and assess conditions
- If workable, teams separate to respective survey areas/strata
- Fish Survey:
- Each fish diver works at their assigned depth (2-3 transects)
- Collects photographic records of site and notable, hard to id species
- Notes noteworhtly off transect observations
- Benthic Survey:
- Team descends together to the 20m depth stratum
- If eDNA collection is planned, recruit/invert diver collects water samples first
- 50m transect line deployed by benthic diver.
- Benthic diver (LPI):
- Starts at 50m mark
- Works toward 0m recording points every 20cm
- Coral diver:
- Starts at 0m mark
- Works toward 50m identifying coral species at points
- Recruit/invert diver:
- Starts at 45m mark with quadrat surveys (every 5m)
- After completing quadrats, stashes equipment
- Returns along transect recording invertebrates
- Completion and transition:
- Divers meet at transect end
- Team recovers transect reel and equipment
- Group ascends together to 10m depth stratum
- Entire process repeated at 10m depth
- Exit coordination:
- All divers return to mooring/entry point
- Team conducts safety stop together
- Surfaces at initial entry point
- Post-dive procedures:
- Team leader completes site documentation
- Each diver completes method-specific datasheets
- Equipment prepared for next dive
- Data entered into digital format at the end of the day.
This coordinated approach ensures that comprehensive ecosystem data is collected at each station while maintaining methodological consistency and diver safety.
Documentation and Quality Control
UVS Sites Fieldbook
The UVS Sites Fieldbook is the primary reference for recording site-specific information and survey activities during expeditions. Maintained by the dive team lead, it serves as the authoritative source for cross-referencing UVS datasets and ensuring data consistency.
Daily records include:
- Location Details: Region, subregion, locality, site name
- Accurate Coordinates: GPS coordinates (WGS84)
- Site Conditions: Habitat type and exposure level
- Protocol Completion: Survey methods executed and any deviations noted
- Field Notes: Notable observations, incidents, and contextual informatio
All habitat types and exposure levels must be recorded using the controlled vocabulary specified below. This standardization is critical for understanding ecological patterns, enabling comparisons across sites, and assessing habitat-specific community structure and condition.
Habitat types
This vocabulary standardizes the classification of benthic environments encountered during underwater visual surveys. It includes coral reef zones, temperate habitats, and other dominant seafloor types relevant to ecological analysis.
Habitats
Habitat
wall— Vertical or very steep reef drop-off
fore_reef— Seaward-facing outer slope of coral reef
reef_flat— Horizontal shallow zone near the crest
back_reef— Lagoon-facing side behind the reef crestpatch_reef— Isolated reef outcrop within lagoon or sand plain
channel_pass— Channel through reef system with strong flow
pinnacle— Steep-sided, often isolated coral structures
rocky_reef— Non-coral reef formed from rock, with reef biota
seagrass— Dominant seagrass bed habitat
kelp_forest— Dense canopy-forming macroalgae habitat
bank— Flat-topped offshore feature with reef or rocky habitat
Exposure
This classification describes the hydrodynamic setting of a site, based on relative exposure to wave energy, swell, or current. It helps interpret ecological patterns linked to environmental forcing.
Exposure
Exposure
windward— Exposed to prevailing swell or wind; typically high wave energy and surge
leeward— Sheltered side of reef or island protected from prevailing swell
lagoon— Located inside a reef or atoll, generally protected from direct wave action
channel— Within a reef pass or surge channel; often features strong tidal currents
sheltered— Protected from wave energy by a bay or other geomorphic feature
exposed— Generally high energy due to wave or swell exposure; used where windward/leeward doesn’t apply
unknown— Exposure not determined or insufficient data to classify
Protection
The dive team lead is responsible for recording the protection status of each UVS site in the fieldbook. This information is critical for evaluating the conservation context of survey data and assessing MPA effectiveness, particularly for small local MPAs. We record protection status using two fields:
in_mpa: Indicates whether the site is within a protected area (e.g., MPA, no-take zone) or not.mpa_notes: A free-text field to specify the MPA name, protection type (e.g., no-take, seasonal closure), and any local or jurisdictional notes.
Photographic records
Photographic documentation is a core component of the UVS methodology. It provides visual evidence to support species identification, habitat classification, and ecological assessments.
Each diver is responsible for capturing clear, high-quality images and delivering two outputs:
- Complete photo set: All images, organized in folders by station ID, following standard file naming conventions.
- Curated selection: A subset of the best images, labeled with species names, habitat types, or notable observations. These images are intended for reference libraries, reports, and outreach materials.
Refer to the Media Management section for detailed guidance on file naming conventions, metadata standards, and best practices for imagery organization and submission.
Quality Assurance Procedures
To maintain data integrity across all UVS methods, we implement these key quality control measures:
Same-Day Data Entry
Record all observations immediately after diving while details remain fresh and accurate
Daily QAQC Review
Save data to the ship’s NAS for quality checks, including mapping of survey sites to check accuracy and inform planning
Species Verification
Confirm identifications using photographic evidence and our physical and digital reference library
Taxonomic Standardization
Minimize taxonomic errors by using the team’s taxonomic reference list for consistent species identification and database linkage
Source Documentation
Archive original field datasheets securely for future reference and verification
Cross-Referenced Records
Ensure consistency by validating all method-specific data against the UVS Sites Fieldbook
Integration for Reef Health Assessment
The Pristine Seas methodology integrates data from all survey components to assess ecosystem health through a standardized set of ecological indicators.
These metrics provide a holistic assessment of marine ecosystem condition, enabling effective conservation planning and monitoring. We are currently developing a composite reef health index that integrates these indicators into a single, standardized measure to better communicate ecosystem status and facilitate comparative analyses.